How to View Device Details
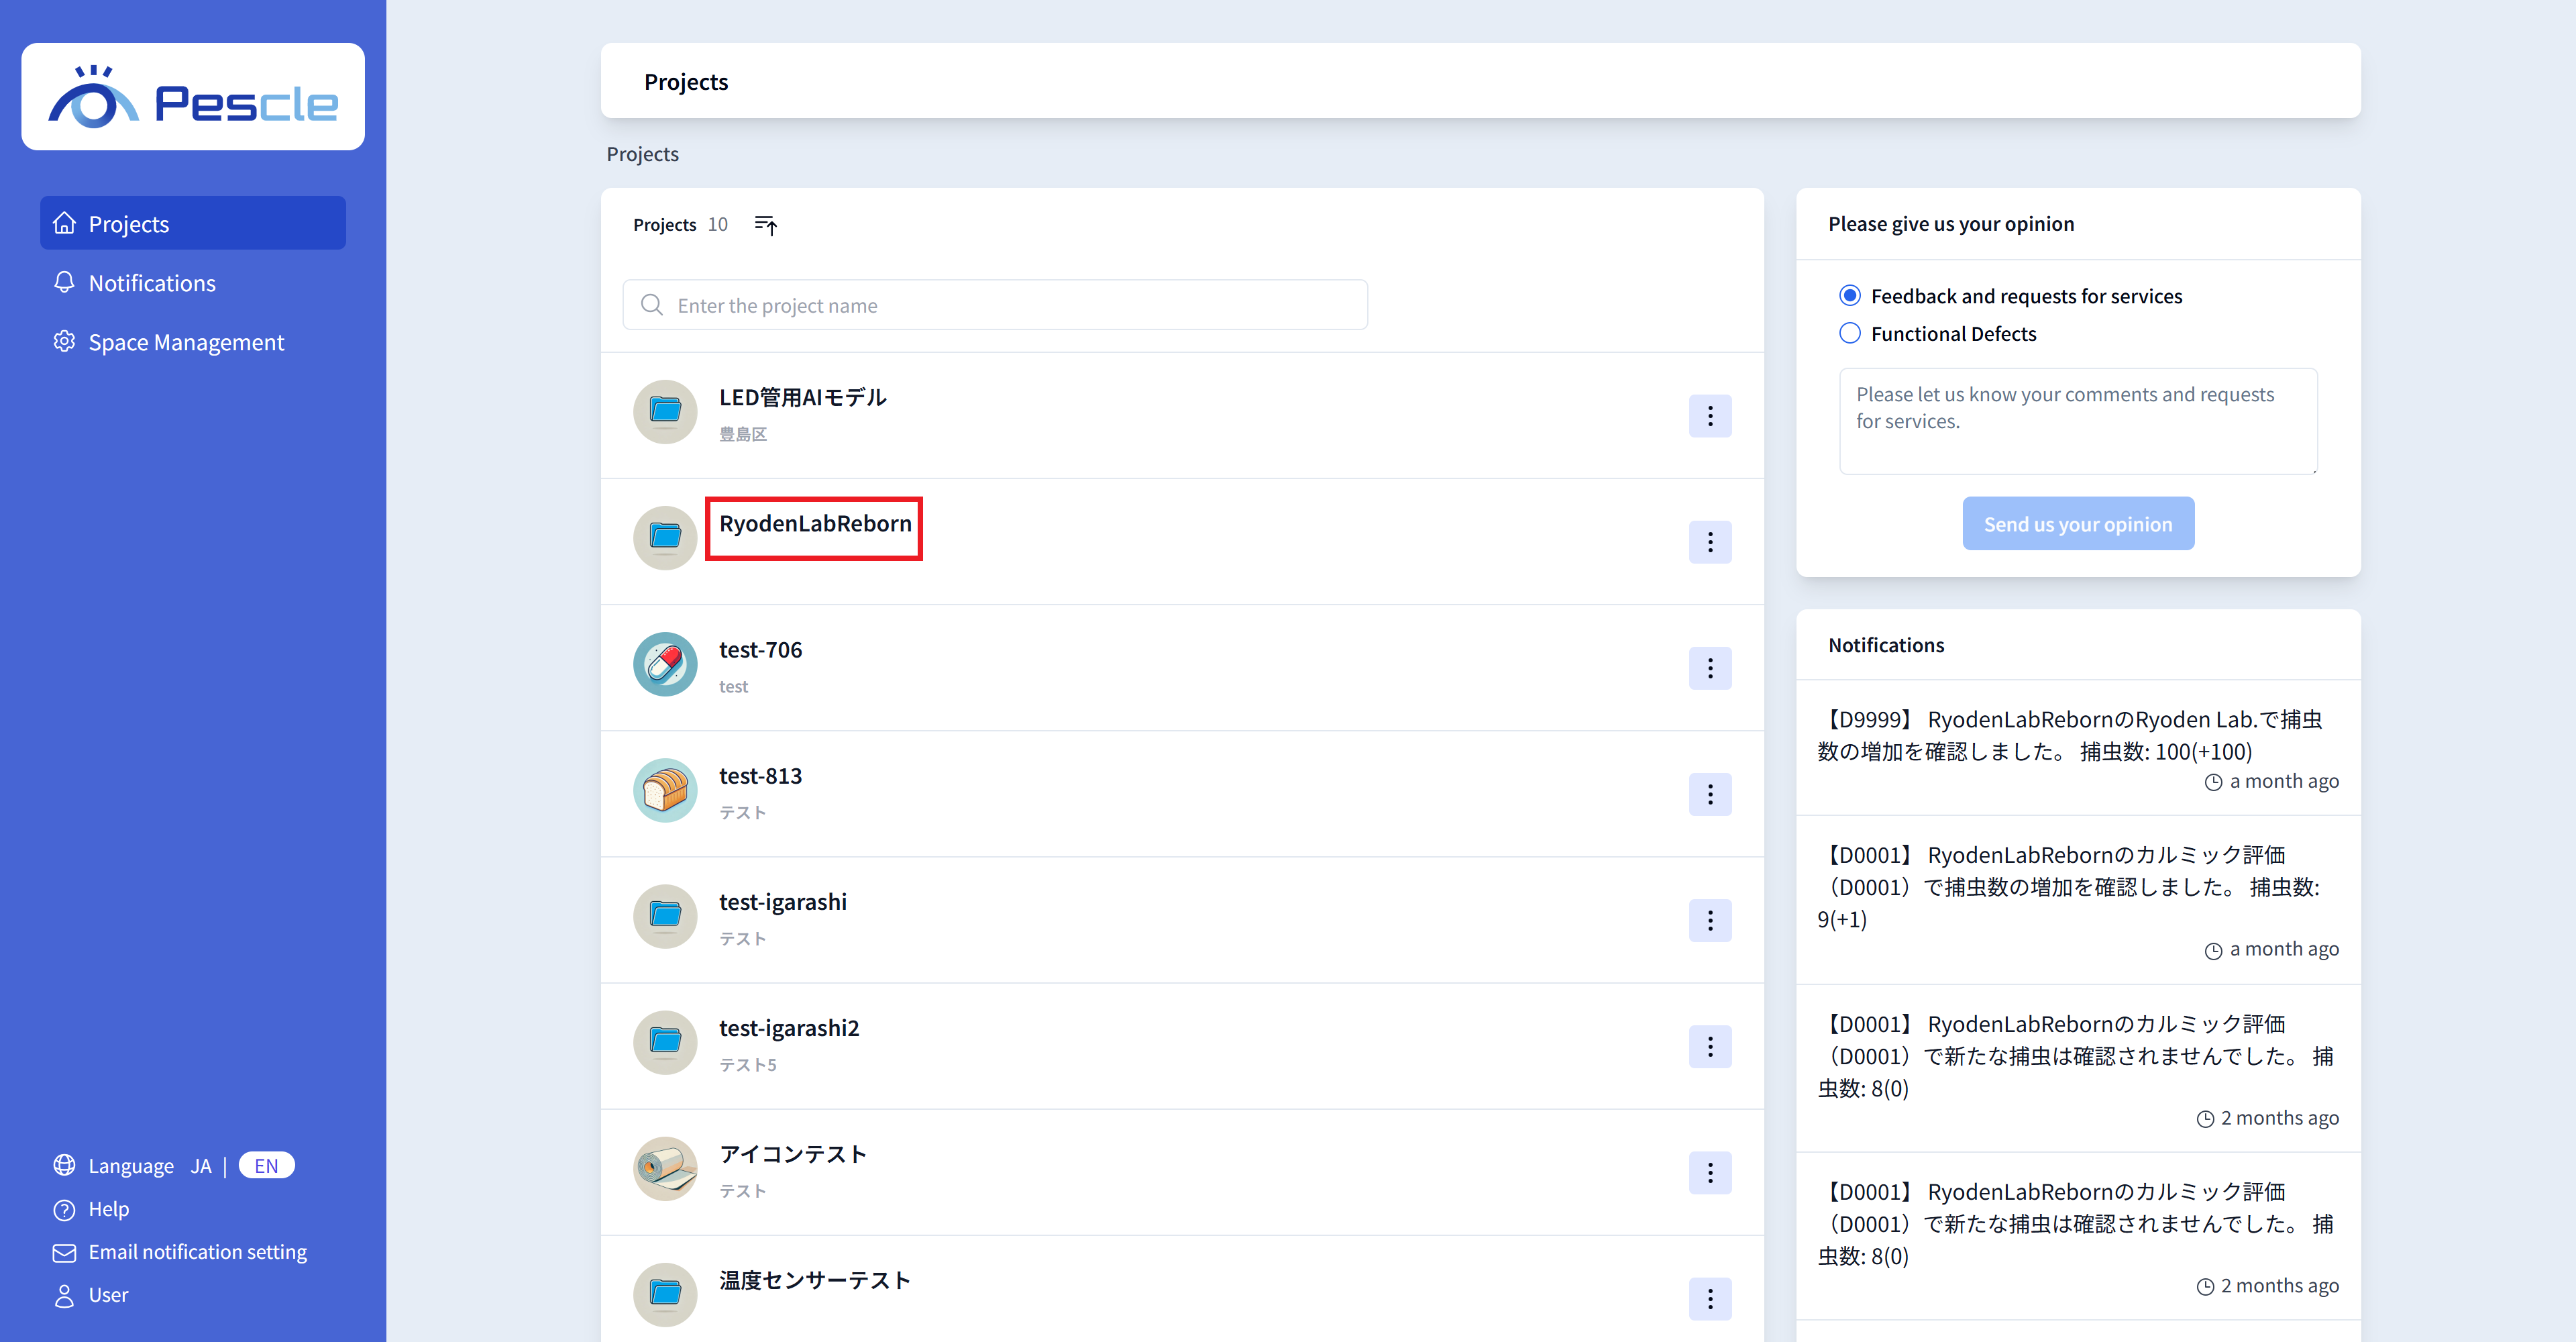
After signing in, the project list will be displayed. Click the project that contains the insect trap camera you want to view.
Tip
If you enter text in the search box above, you can filter the displayed projects.
You can switch between ascending and descending order using the sort button above the search box.
If there are more than 10 projects, you can switch pages using the “Previous” and “Next” buttons at the bottom of the screen.
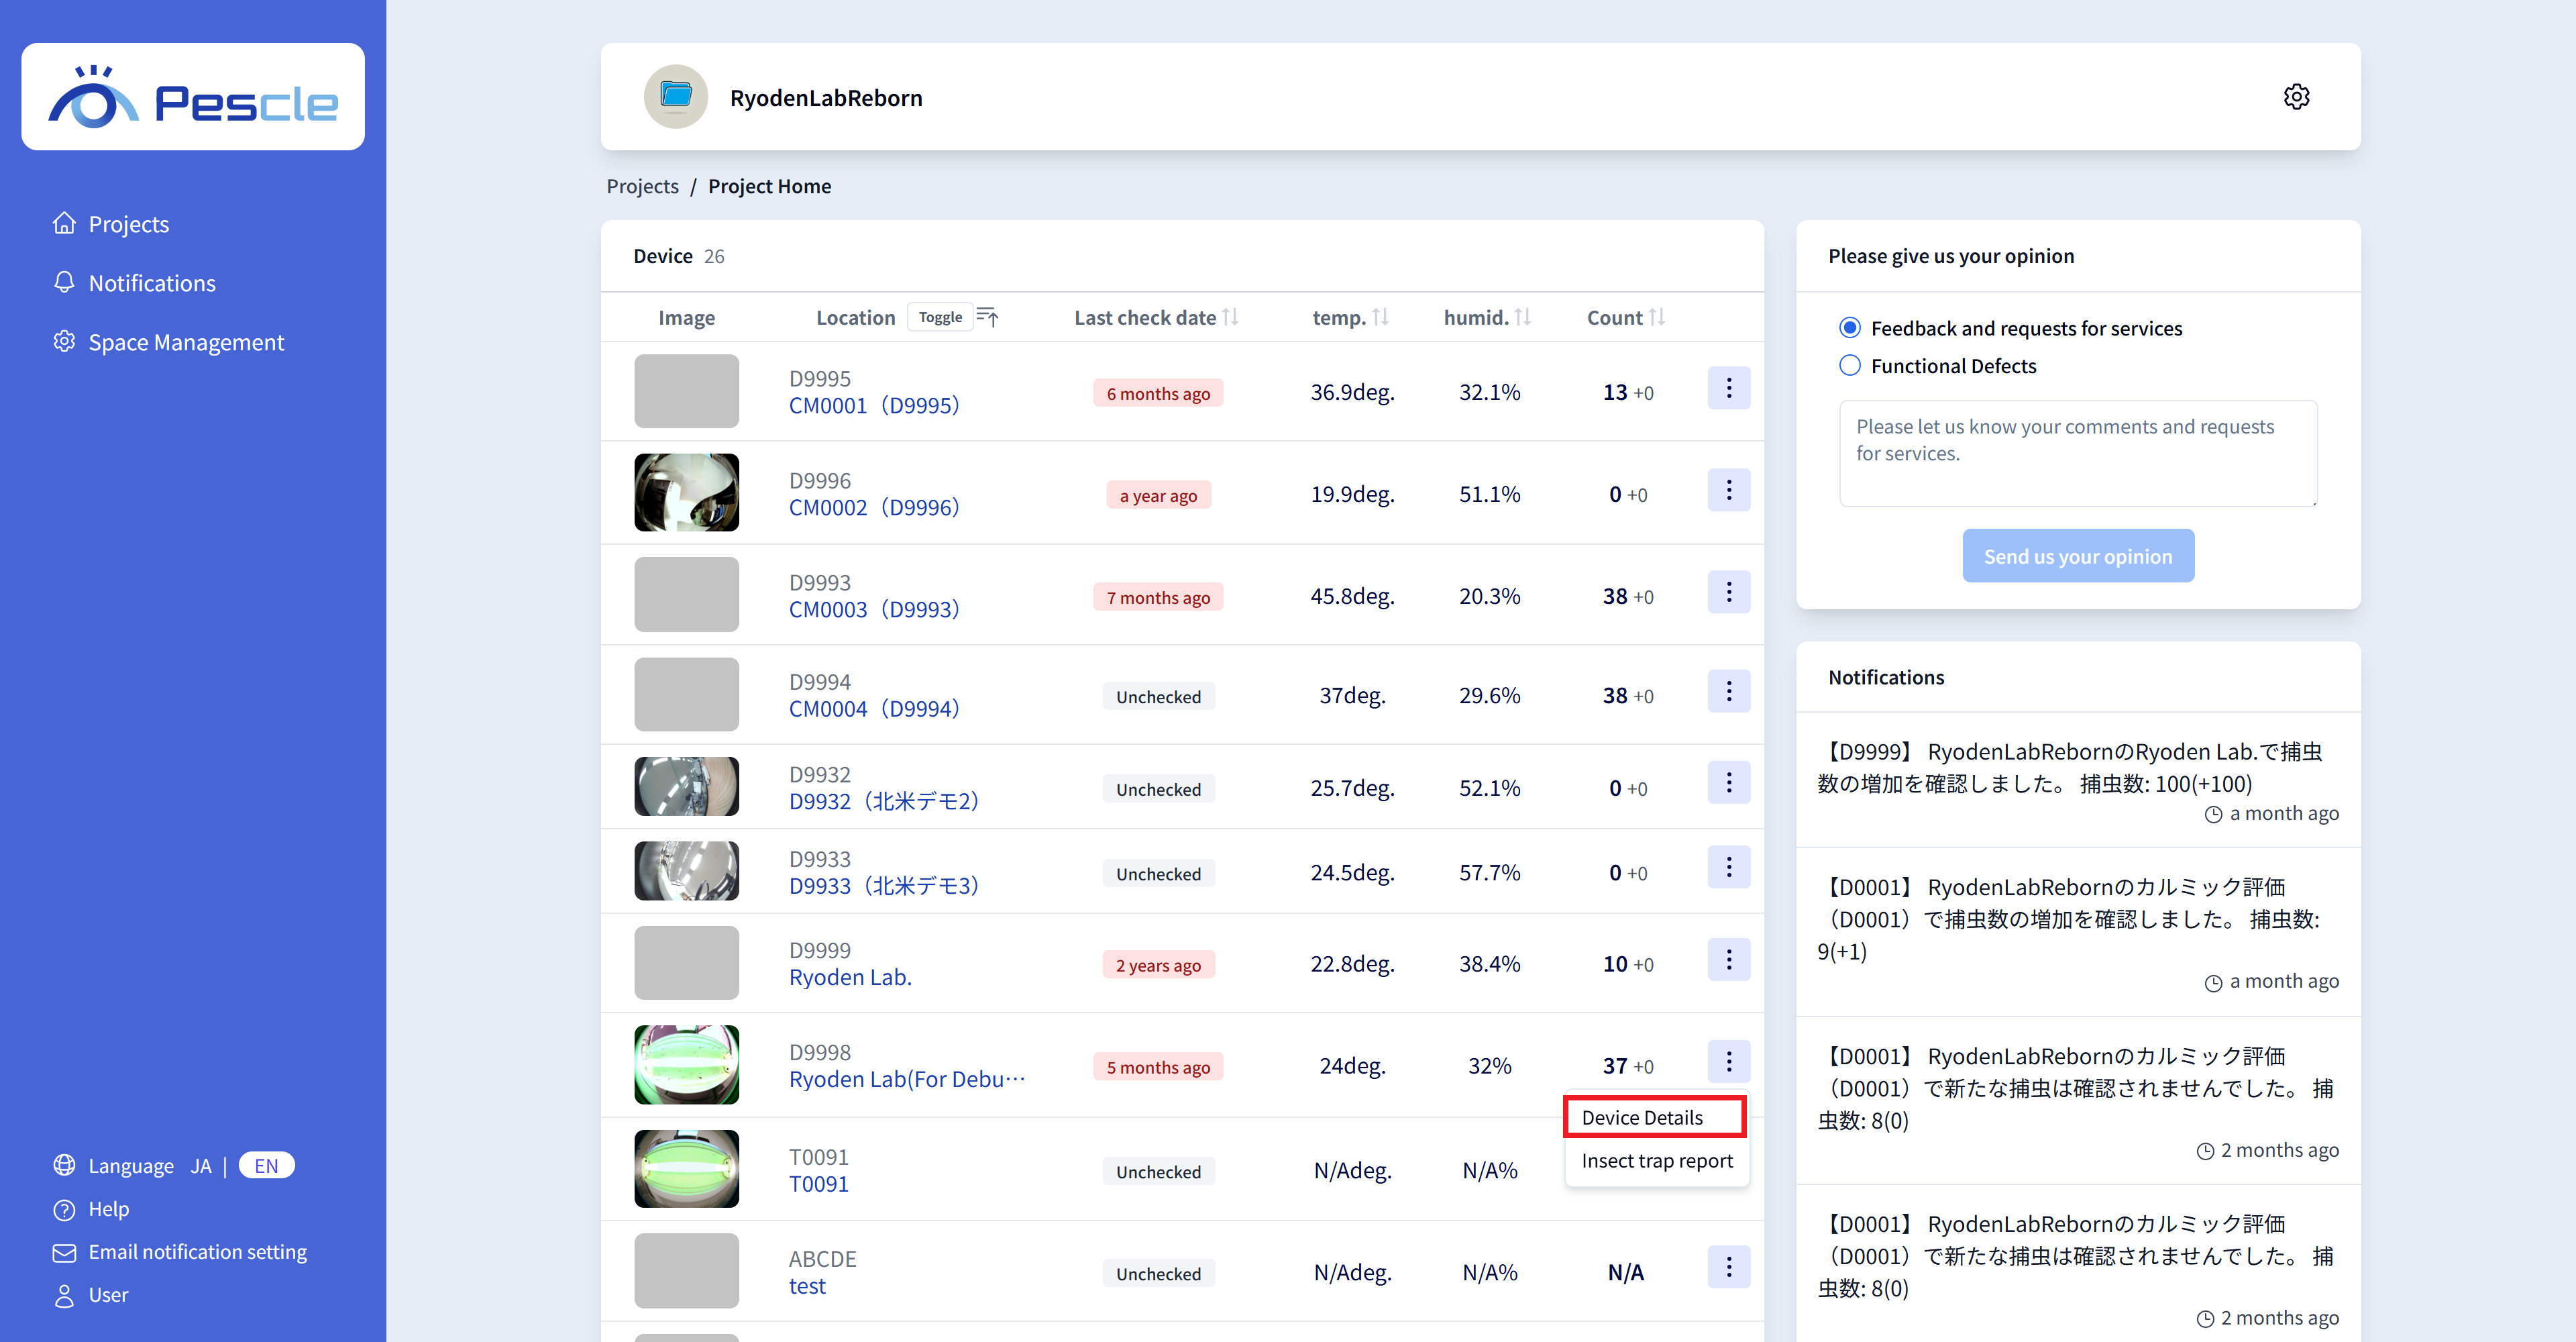
The project home screen will be displayed. Click the vertical three-dot menu on the right side of the device you want to view.
When the submenu appears, click “device details”
Tip
When you click the device’s installation location, you can view the Insect Detection History. For more details, please refer to How to View Insect Detection History.
Tip
When you click “Insect Detection Report” in the submenu, the “Insect Detection Report” will be downloaded. For more details, please refer to How to Download Insect Detection Reports.
How to View Device Details
The device details screen consists of five components.
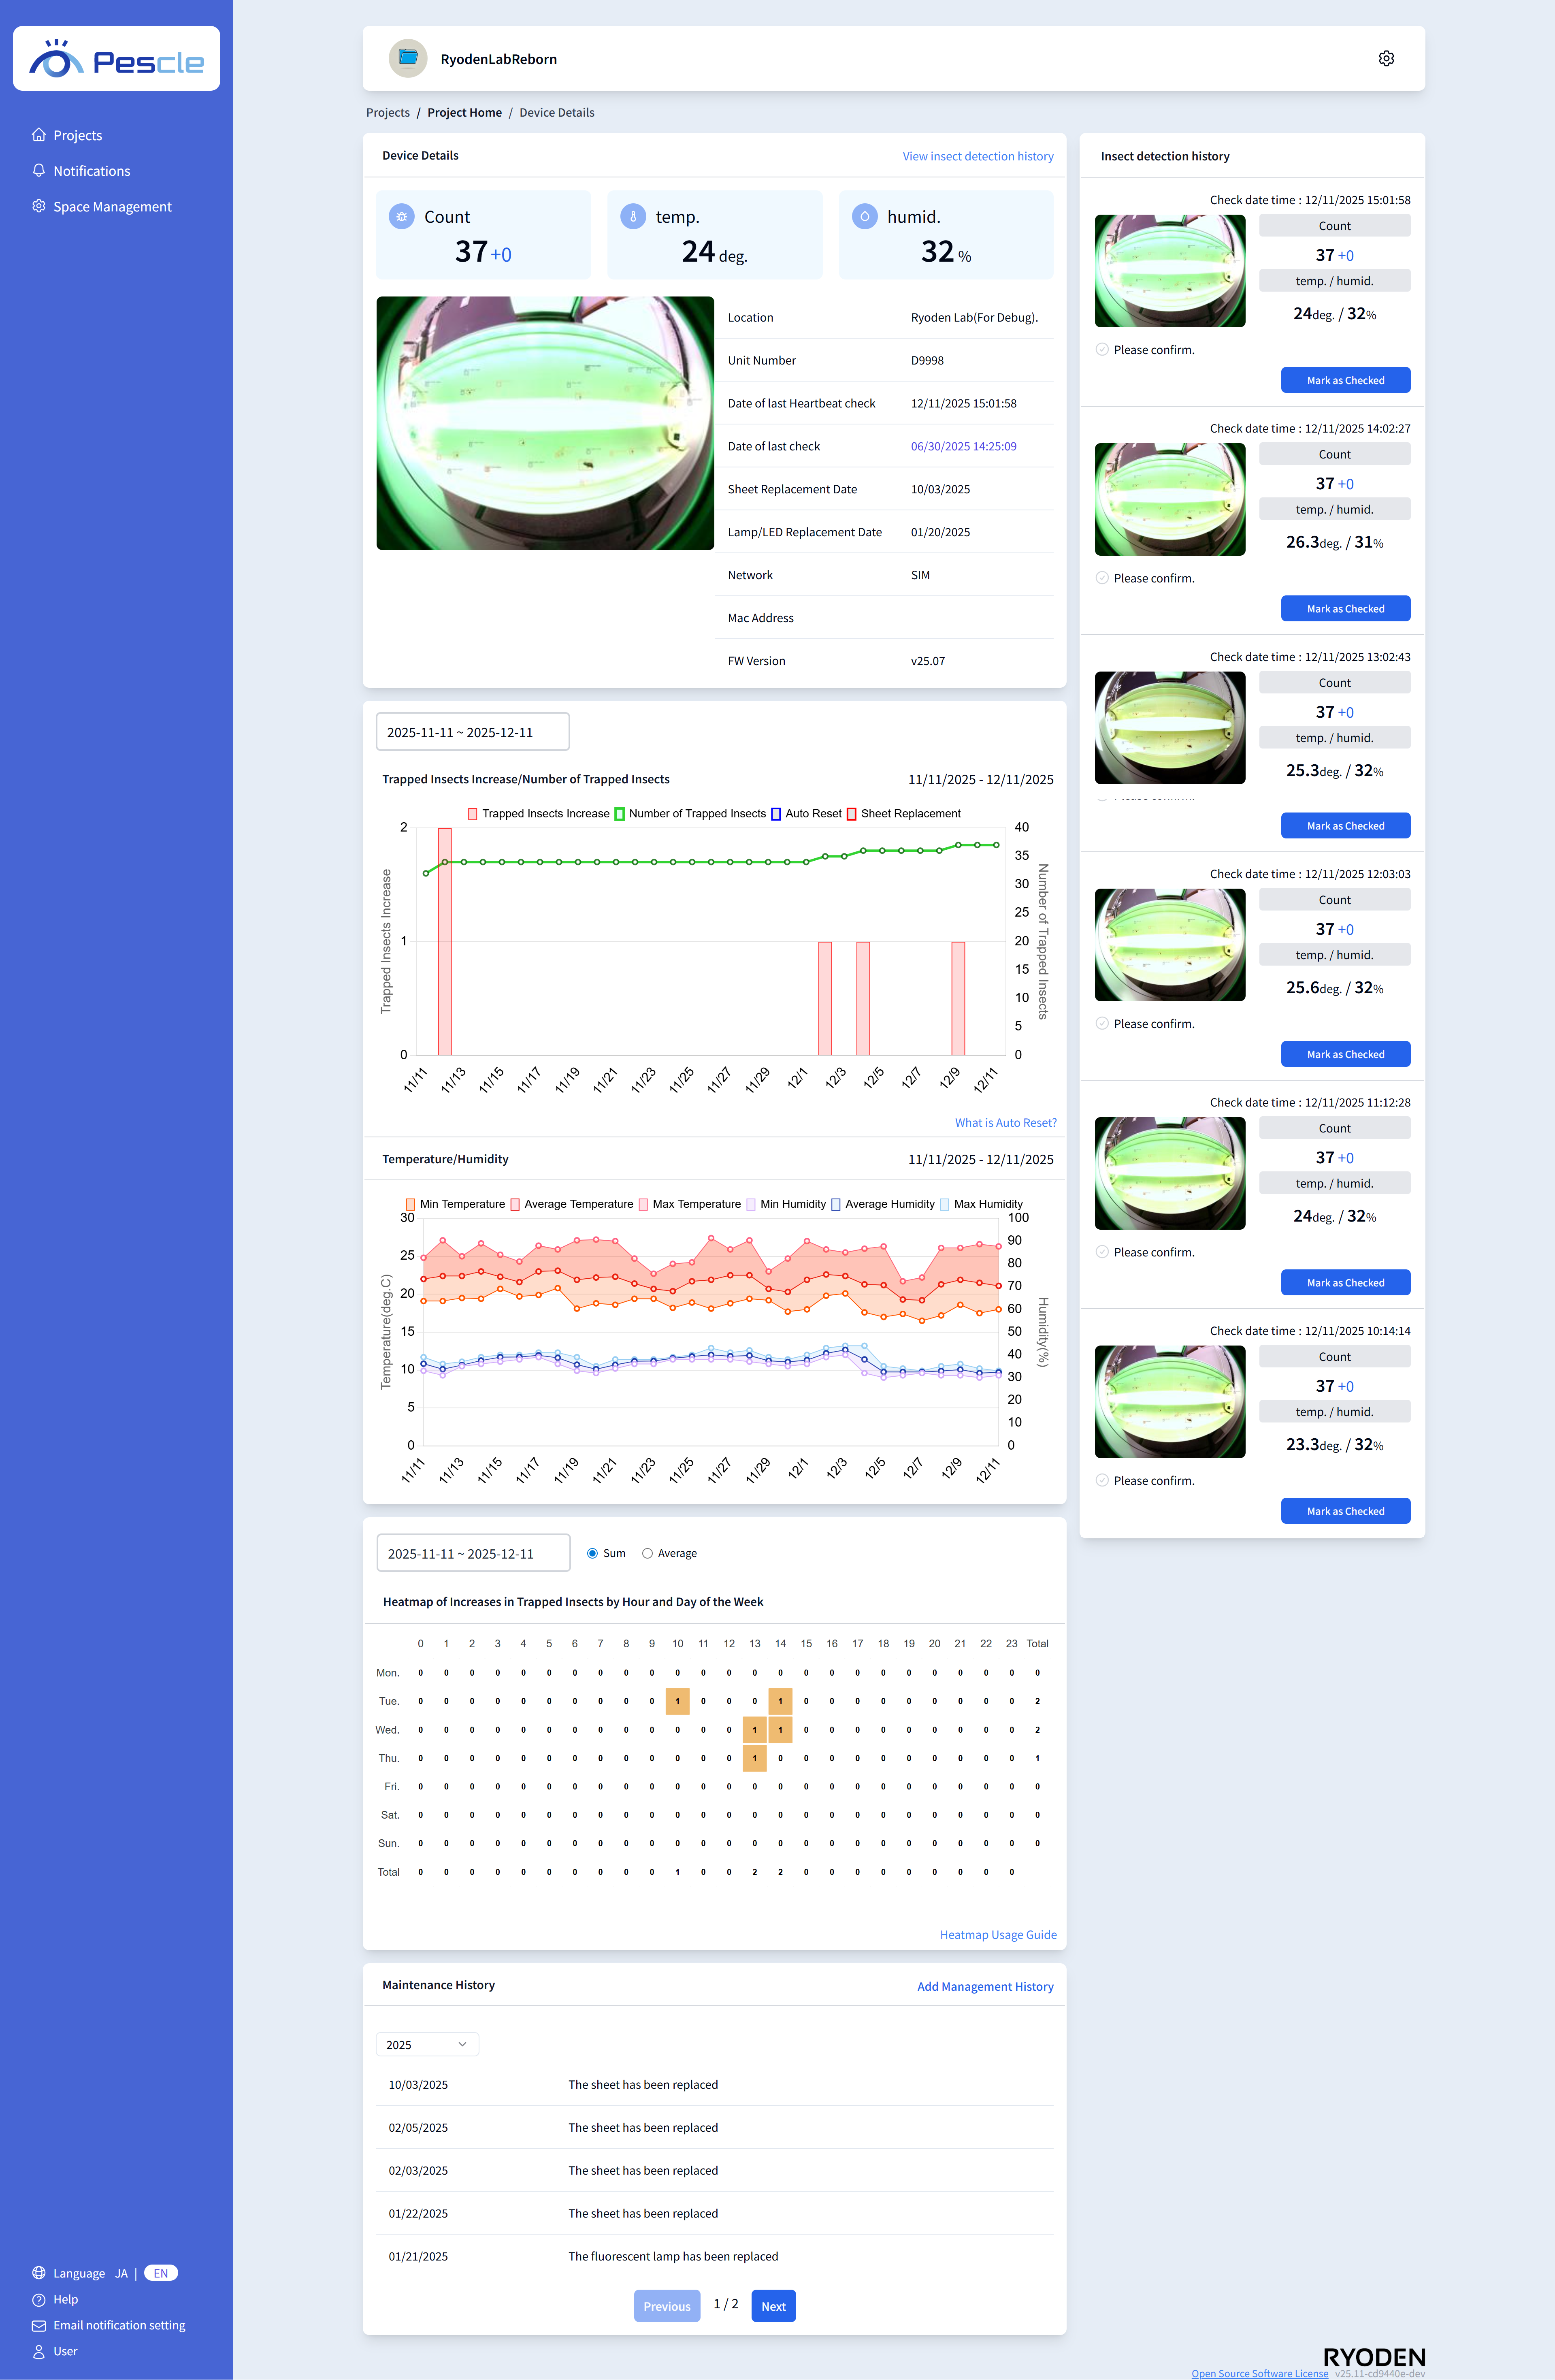
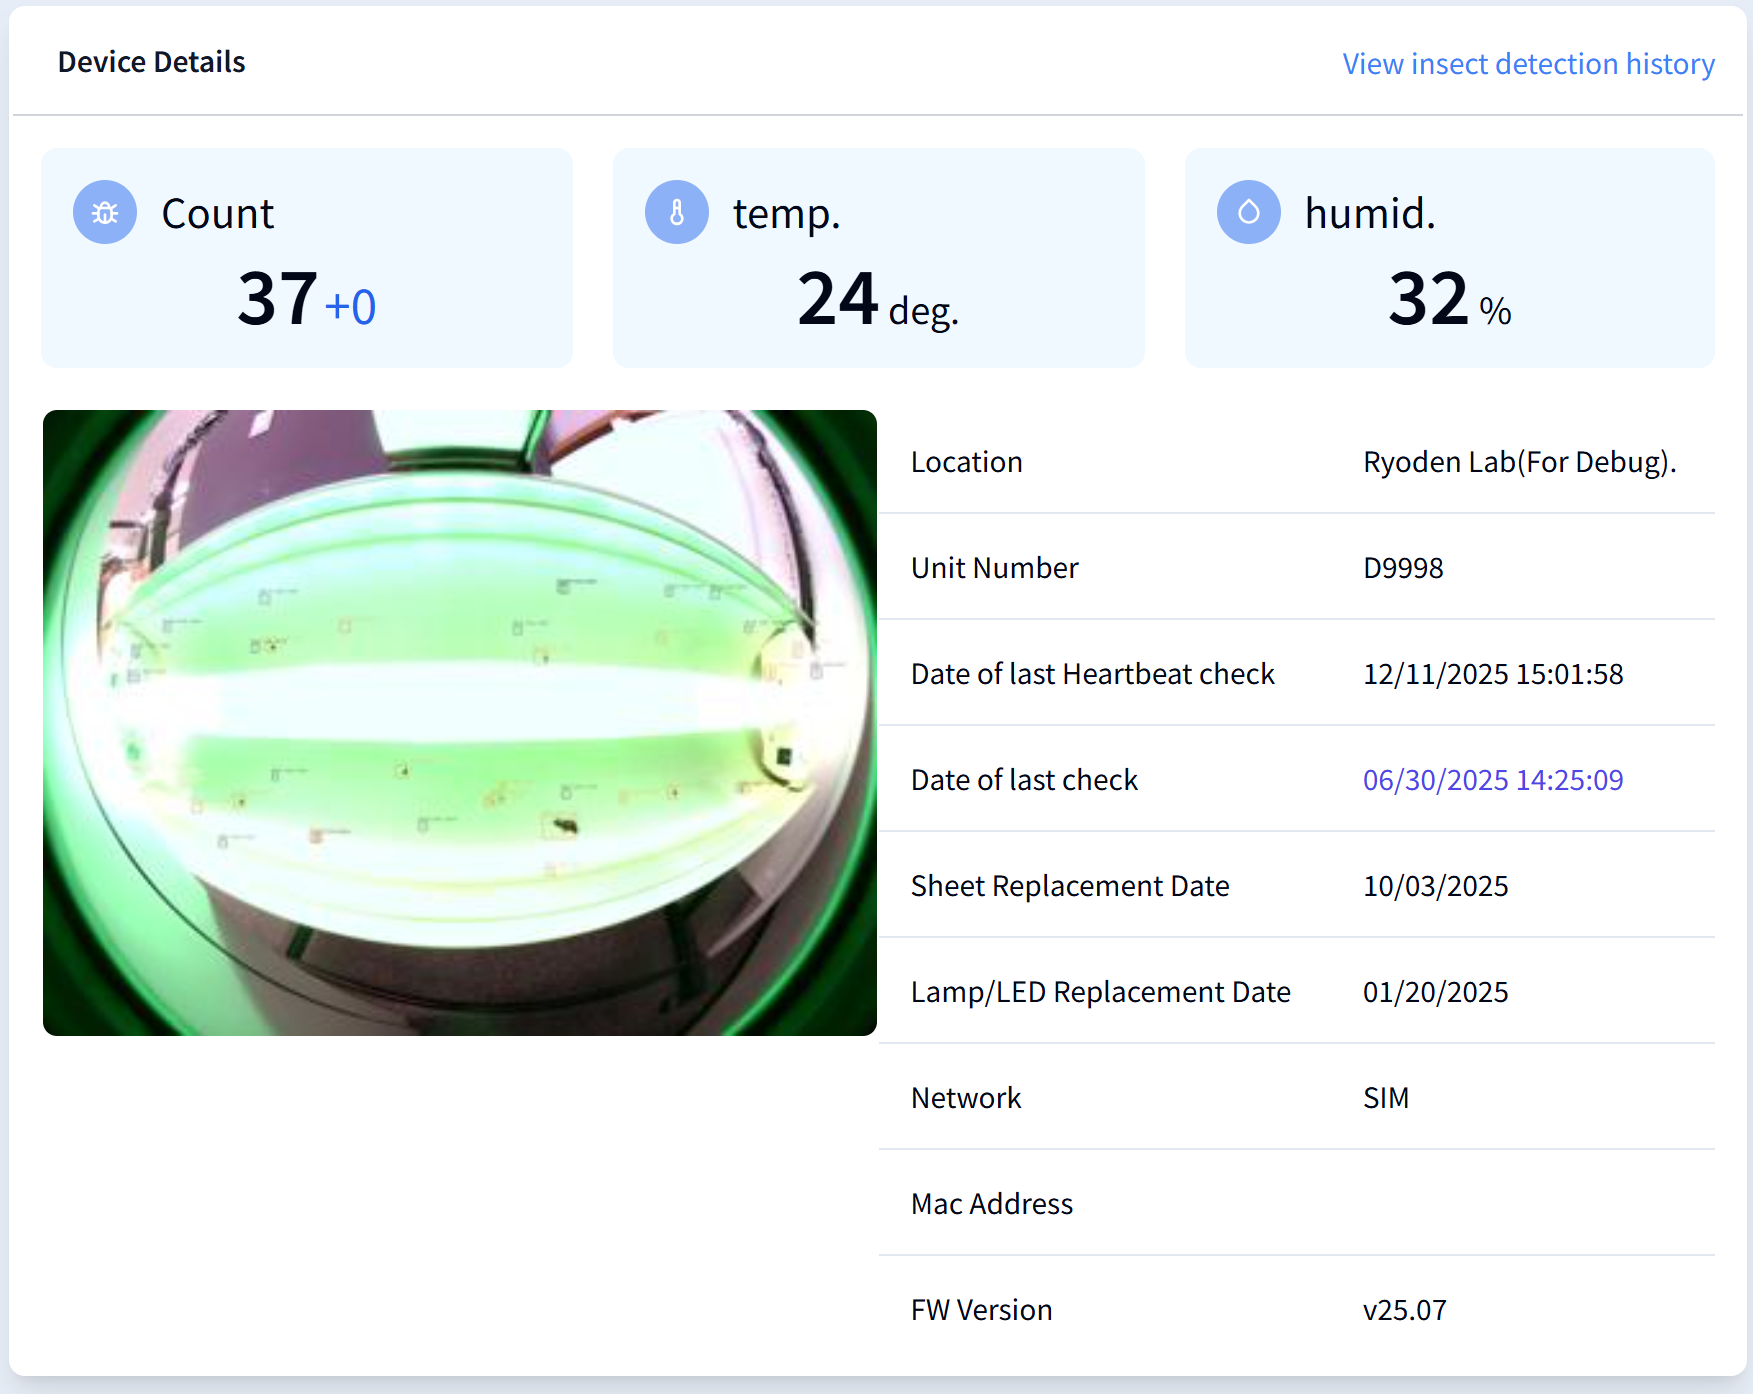
Device Information
You can view various information such as the device’s installation location.
Tip
In the upper right, there is a link that navigates to the “Insect Detection History Screen”. Additionally, the Last Checked Date also contains a link that navigates to the corresponding Last Checked Date in the “Insect Detection History Screen”. For more details, please refer to How to View Insect Detection History.
Notification Banner
If a problem is detected with the insect trap camera, a notification banner will be displayed below the information section.
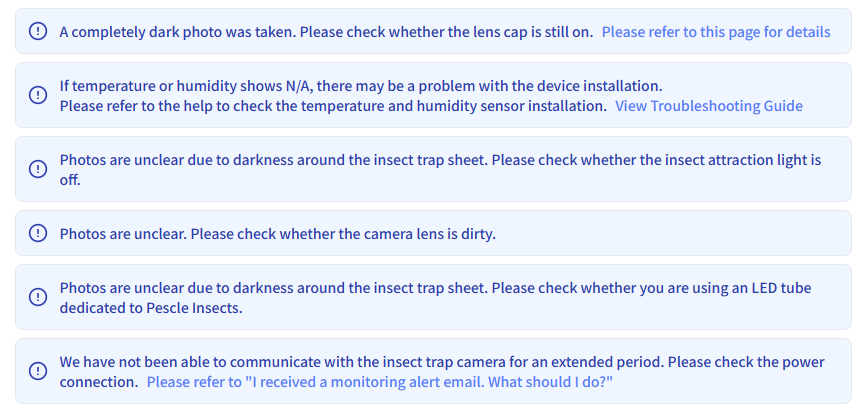
The banner displays the details of the problem. Please respond appropriately according to the content.
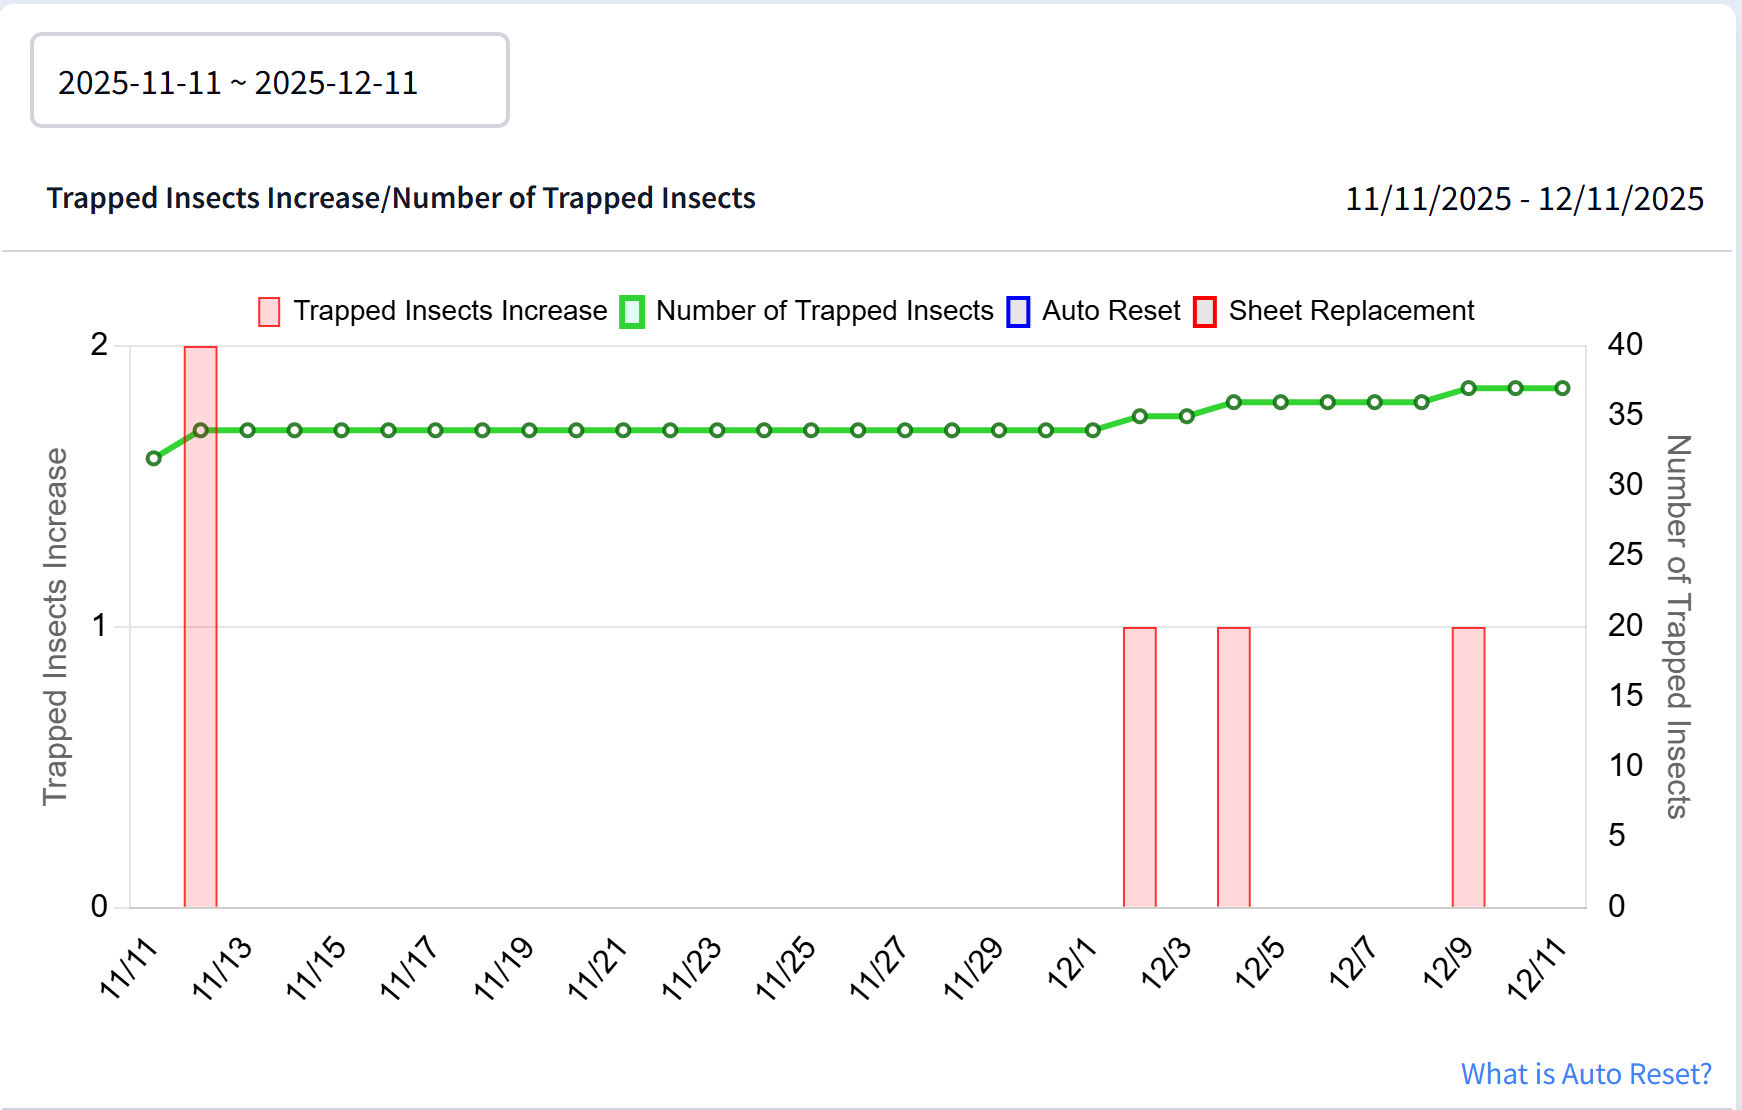
Insect Count Trend Graph
You can check the increasing trend of insect counts in the graph.
Tip
When you select a period in the upper-left corner, you can change the display period of the graph. Additionally, by clicking the legends “Increase in Insect Count” and “Total Insect Count” above the graph, you can toggle their visibility.
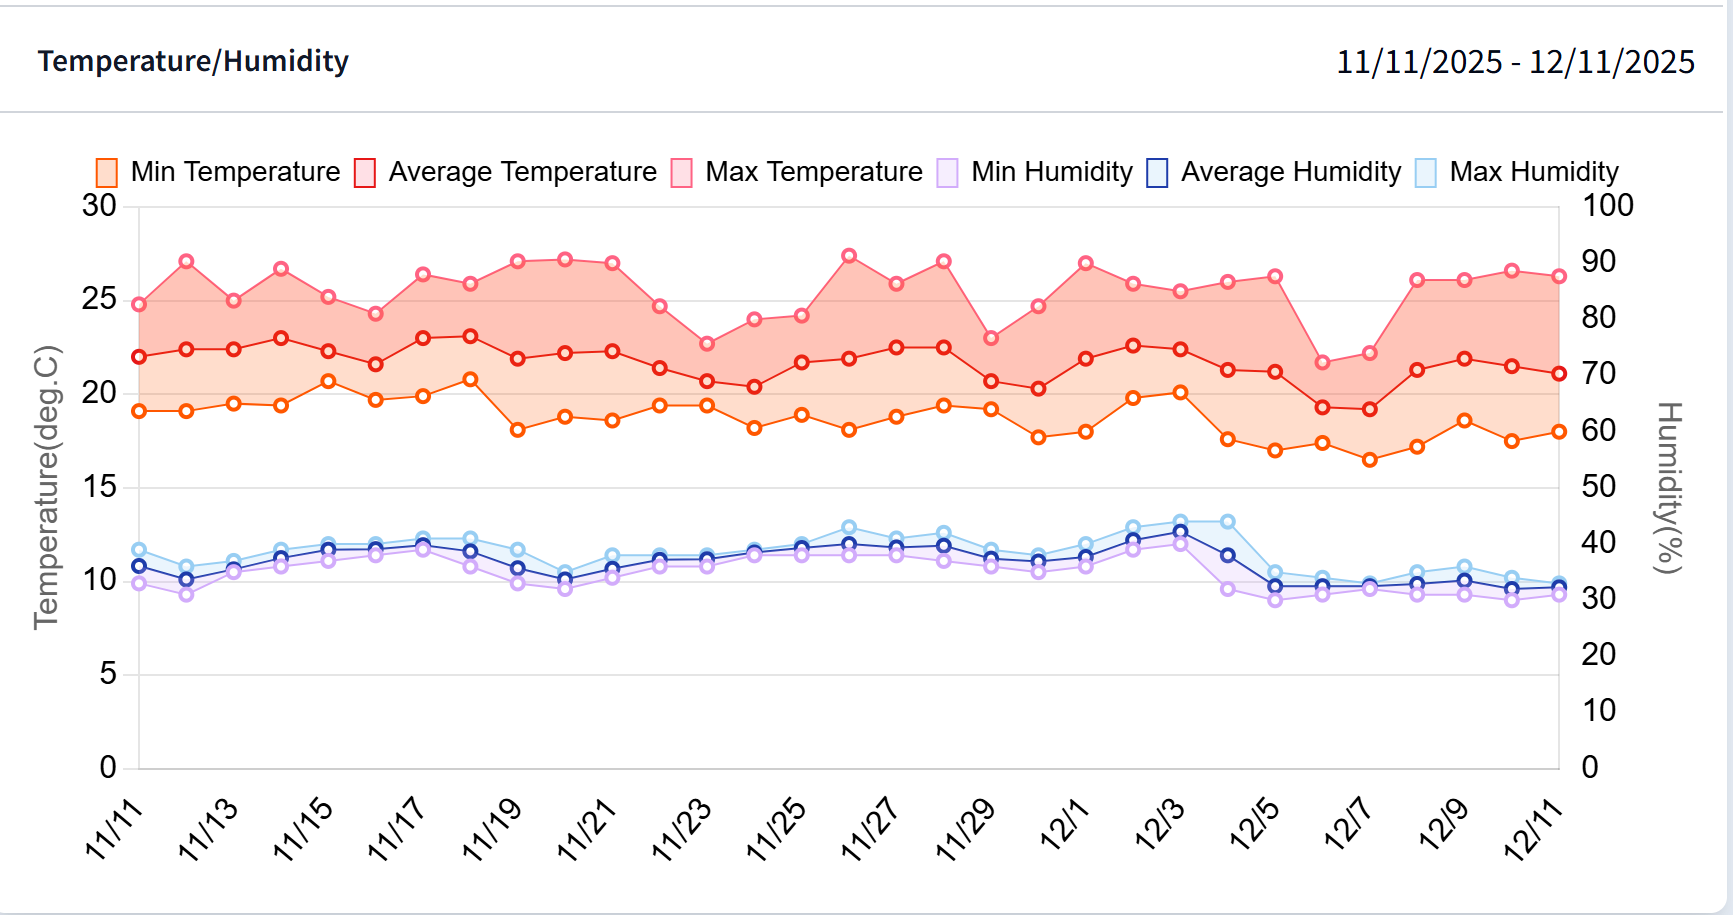
Temperature/Humidity Trend Graph
You can check the correlation between temperature/humidity and insect counts in the graph.
Tip
By clicking the legends above the graph, you can toggle their visibility.
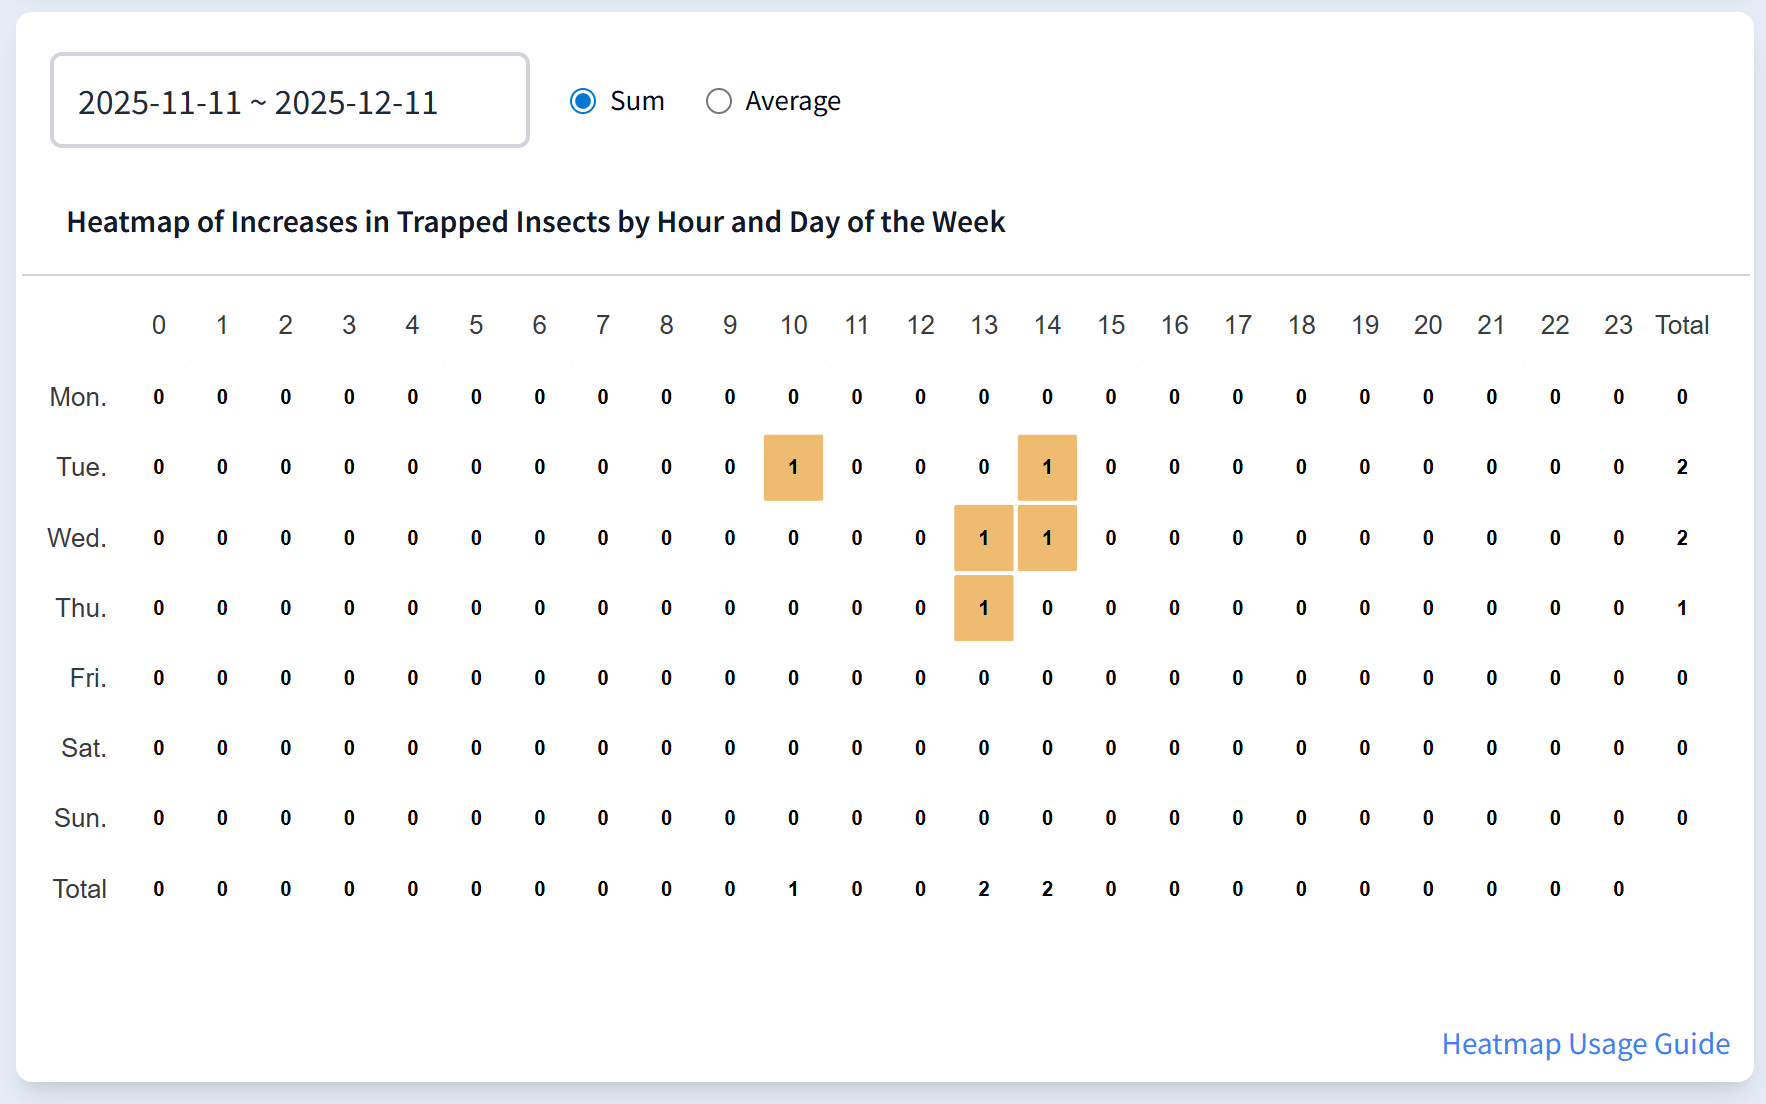
Hourly / Weekly Insect Increase Heatmap
This heatmap allows you to visually check insect increase patterns by time of day and day of the week. The color intensity represents the number of insects, making it easy to see at a glance which time periods and days have the highest concentration of insect activity.
The heatmap includes a “Total” row and column, which display the total and average values for each day of the week, as well as the total and average values for each time period.
The “Total (Row)” displays the total insect count and the average insect count for each day of the week.
The average insect count is a simple sum of the average insect counts for each day of the week.
The “Total (Column)” displays the total insect count and the average insect count for each time period.
The average insect count is a simple sum of the average insect counts for each time period.
This allows you to intuitively understand not only the trends for each day of the week and time period, but also the overall total and average values.
Tip
By selecting a period such as “1 Week”, “1 Month”, or “3 Months” from the period selection dropdown in the upper left, you can switch the display period. By clicking the “Total” and “Average” tabs above the graph, you can switch the data display method.
“Total”: Displays the total insect count within the selected period
“Average”: Displays the average insect count for each day of the week and time period
By utilizing these features, you can analyze insect occurrence patterns at specific times and seasonal variations, helping you plan effective pest control measures.
Maintenance History
You can view maintenance history such as insect sheet replacement and fluorescent lamp replacement.
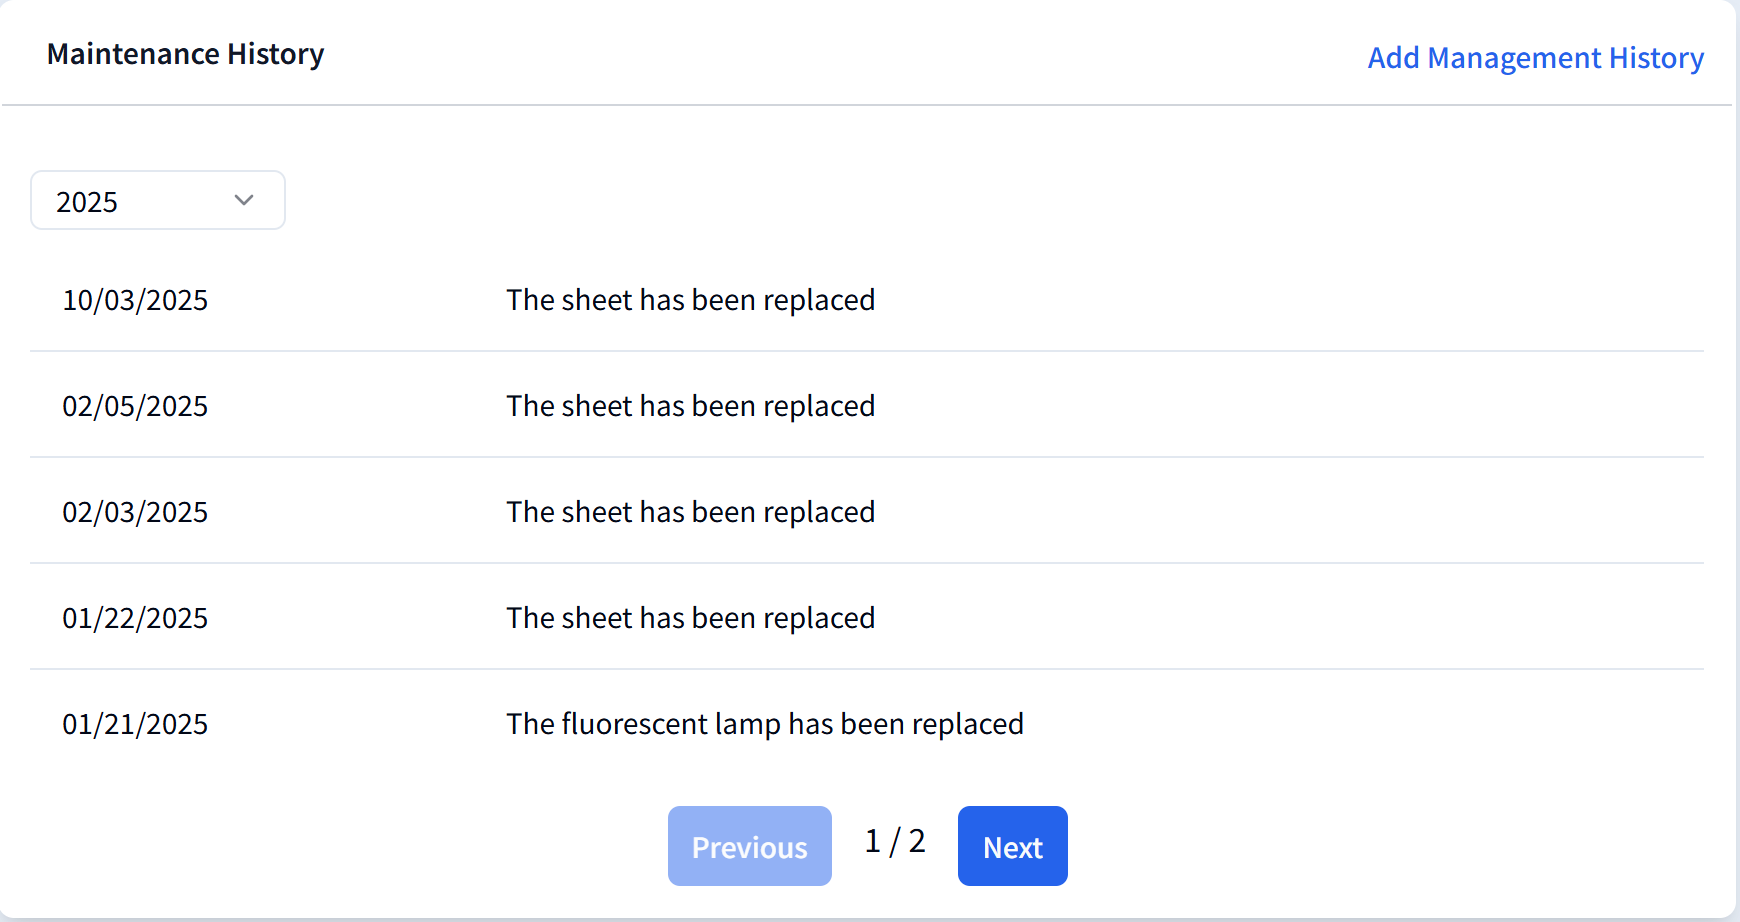
Tip
To add maintenance history, please refer to Add Maintenance History.
