How to View the Device List
Caution
This feature is for space administrators only.
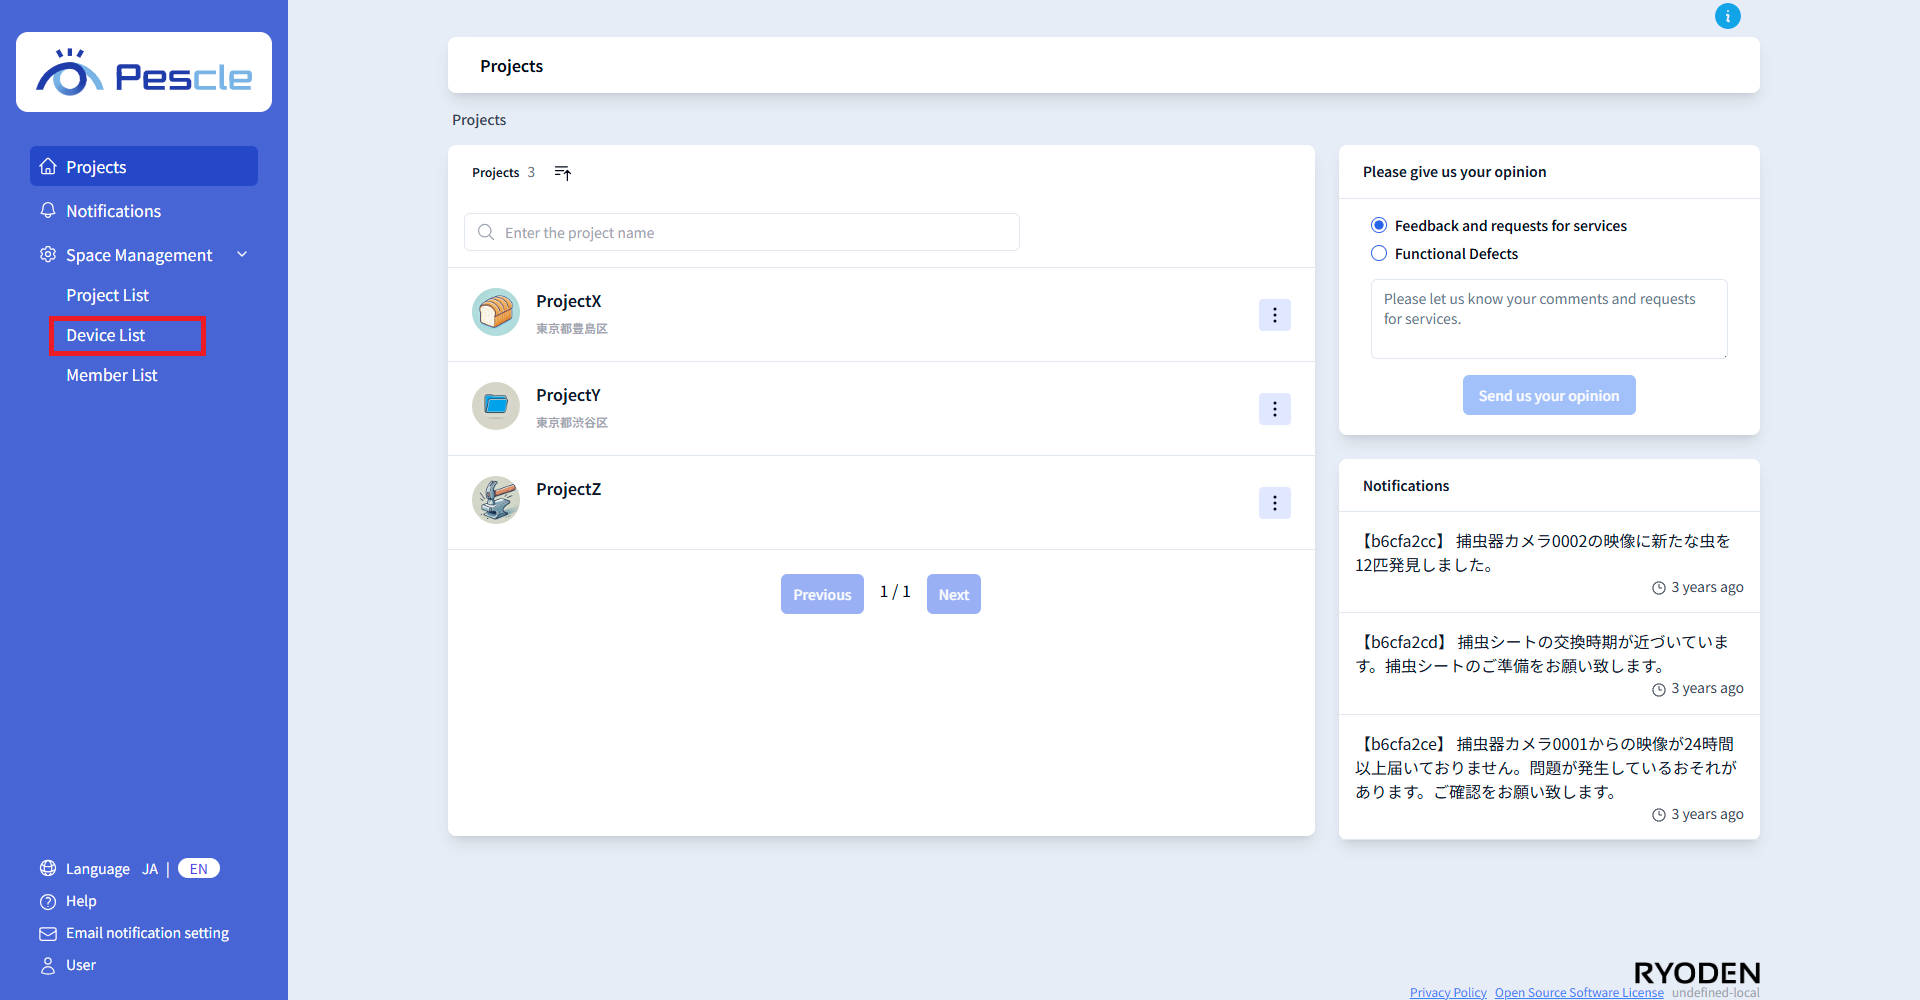
After signing in, the space administration navigation bar will be displayed on the left side of the screen. Click “Device List” under Space Management.
How to Read the Device List
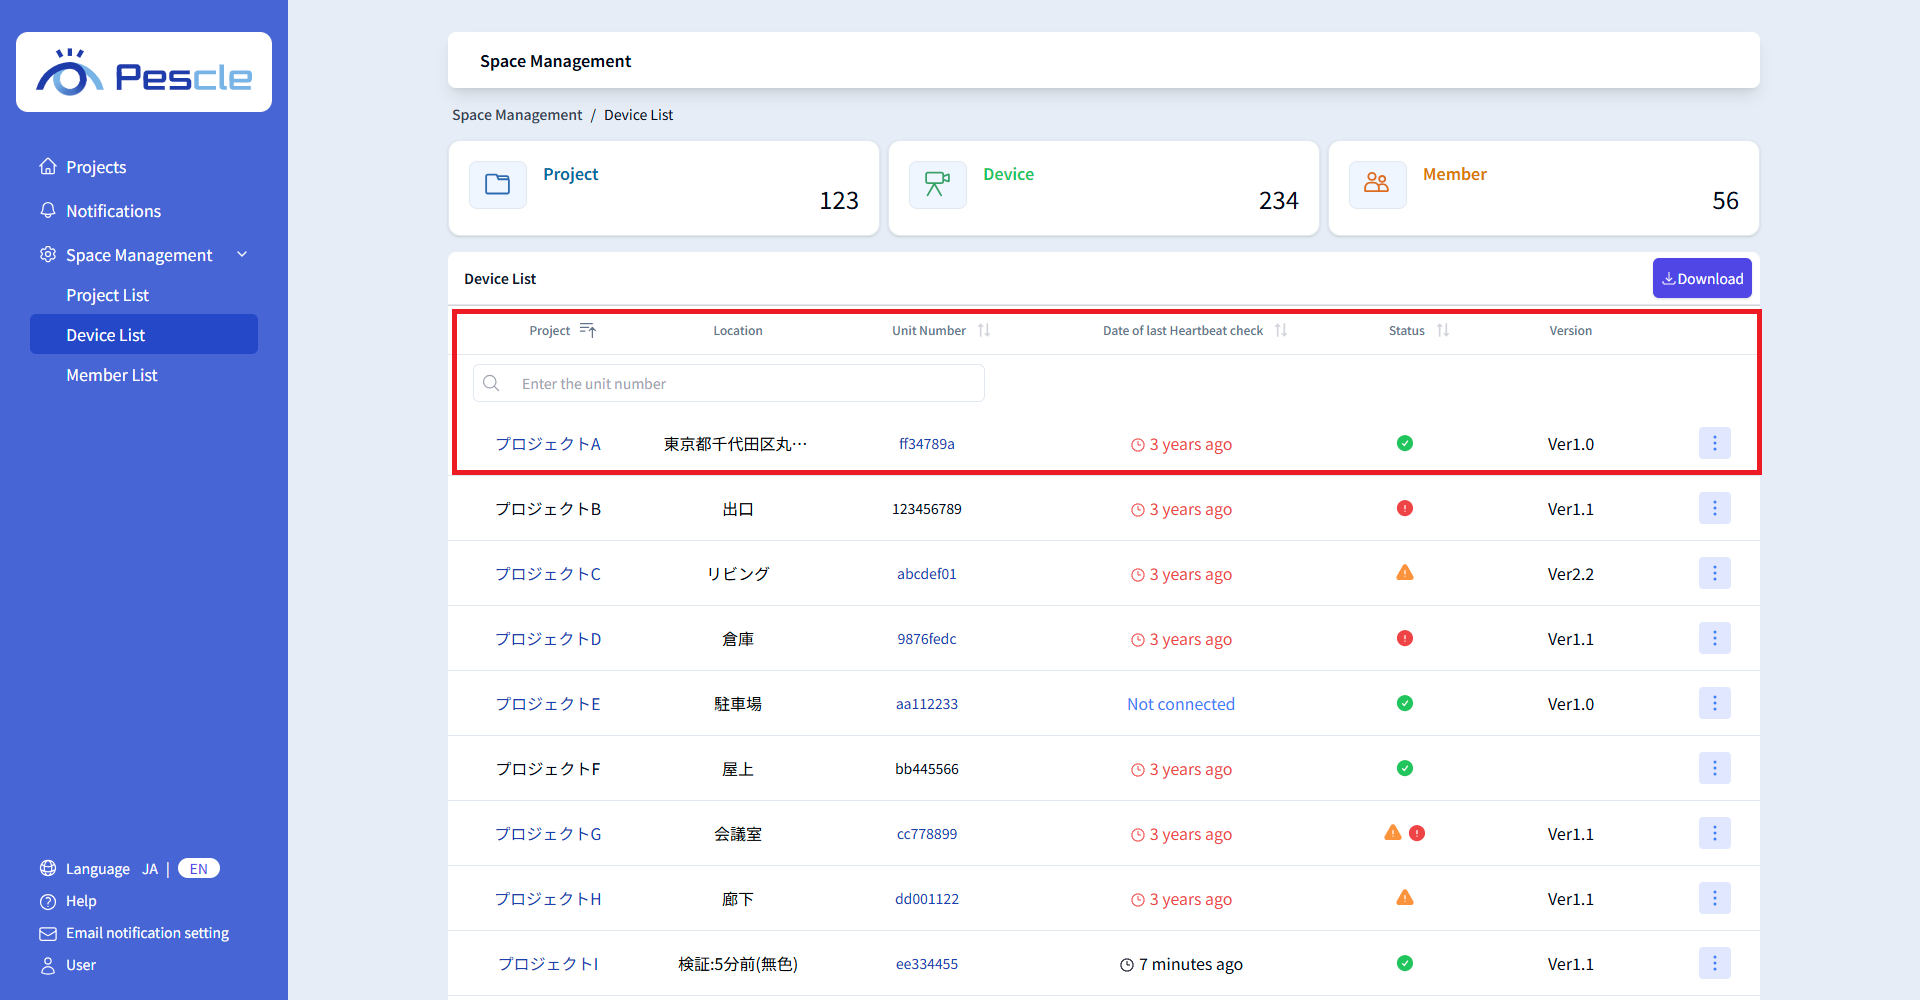
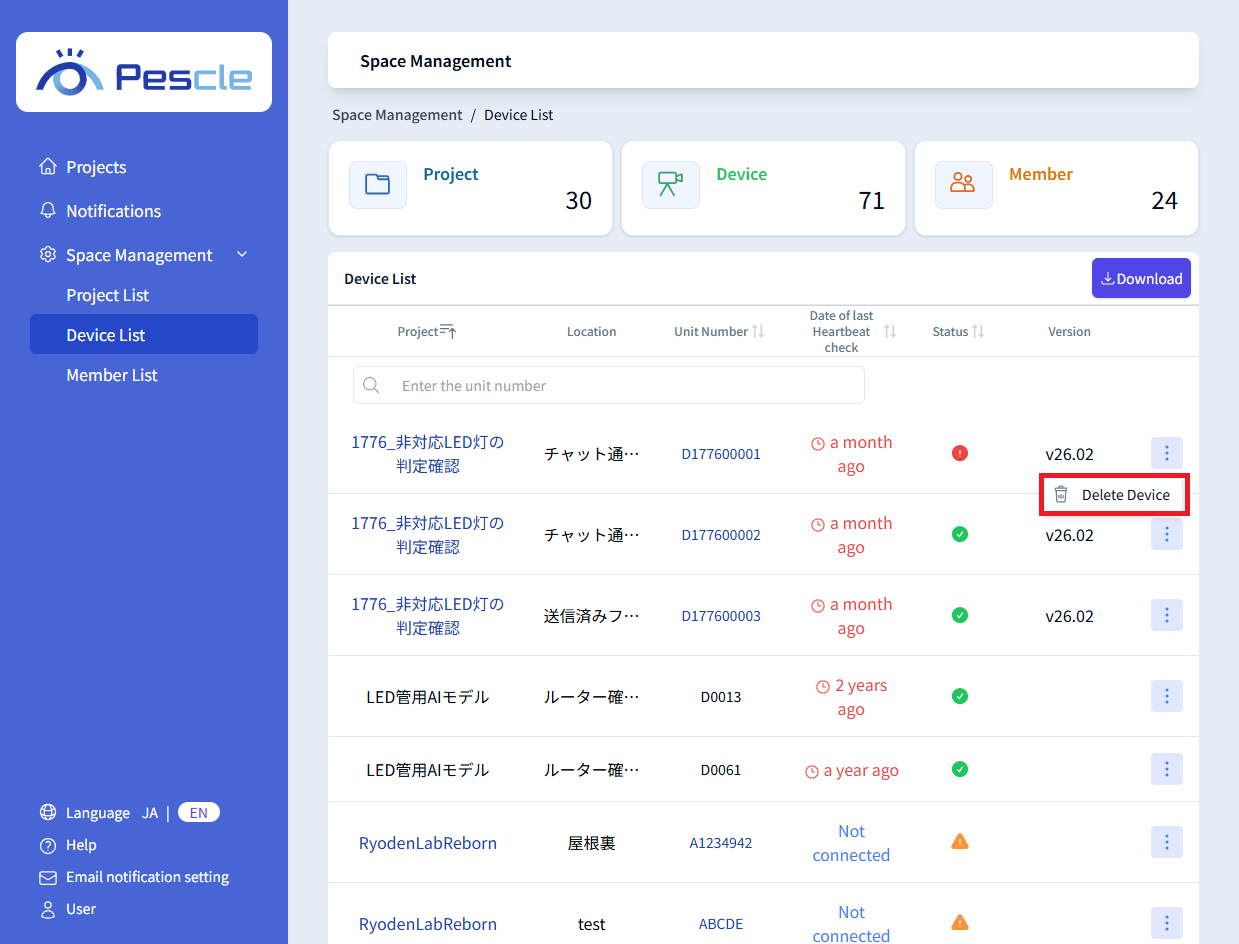
The device list displays the project, installation location, unit number, communication date/time, status, and version.
In the communication date/time column, “Not connected” is shown in blue text if the device has never communicated, and the elapsed time is shown in red text if there has been no communication for 24 hours or more.
How to Read Status Icons
The status of each insect trap camera is shown as an icon. Hovering over an icon displays the details of the status.
 (Icon name: Warning)
Meaning: Displayed when temperature or humidity is N/A.
Displayed on hover:
There may be a problem with the device installation.
 (Icon name: Error)
Meaning: Displayed when an error has occurred (e.g., UV lamp off error, cap error, lens dirt error, LED lamp error, communication error).
Displayed on hover:
UV lamp off error
Cap error
Lens dirt error
LED lamp error
Communication error
How to Display the Menu
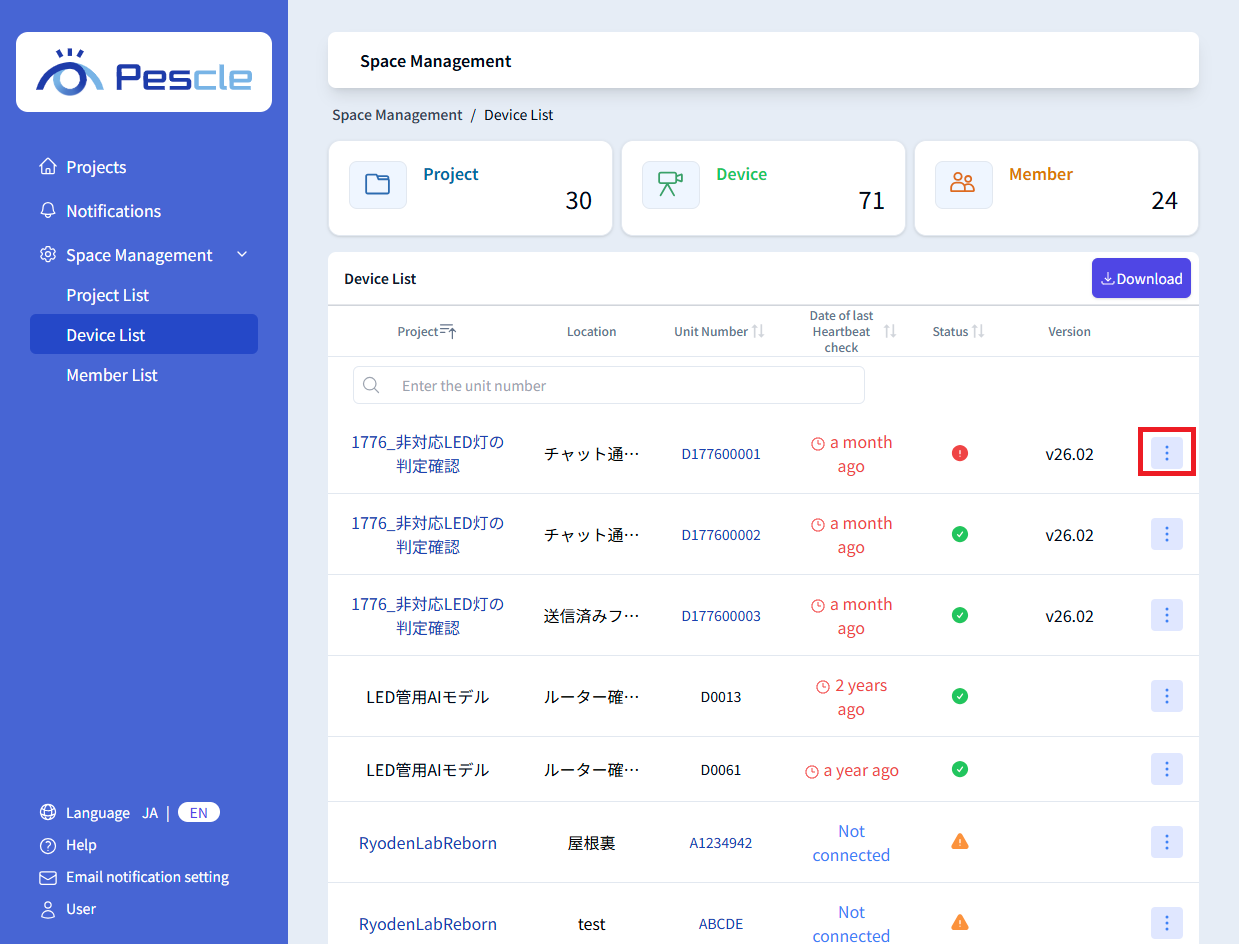
Click the vertical three-dot menu on the right side of the target device to display the menu.
How to Delete a Device
Click “Delete Device” in the menu to delete the device.
For details, see How to Delete a Device.
How to Download the Device List
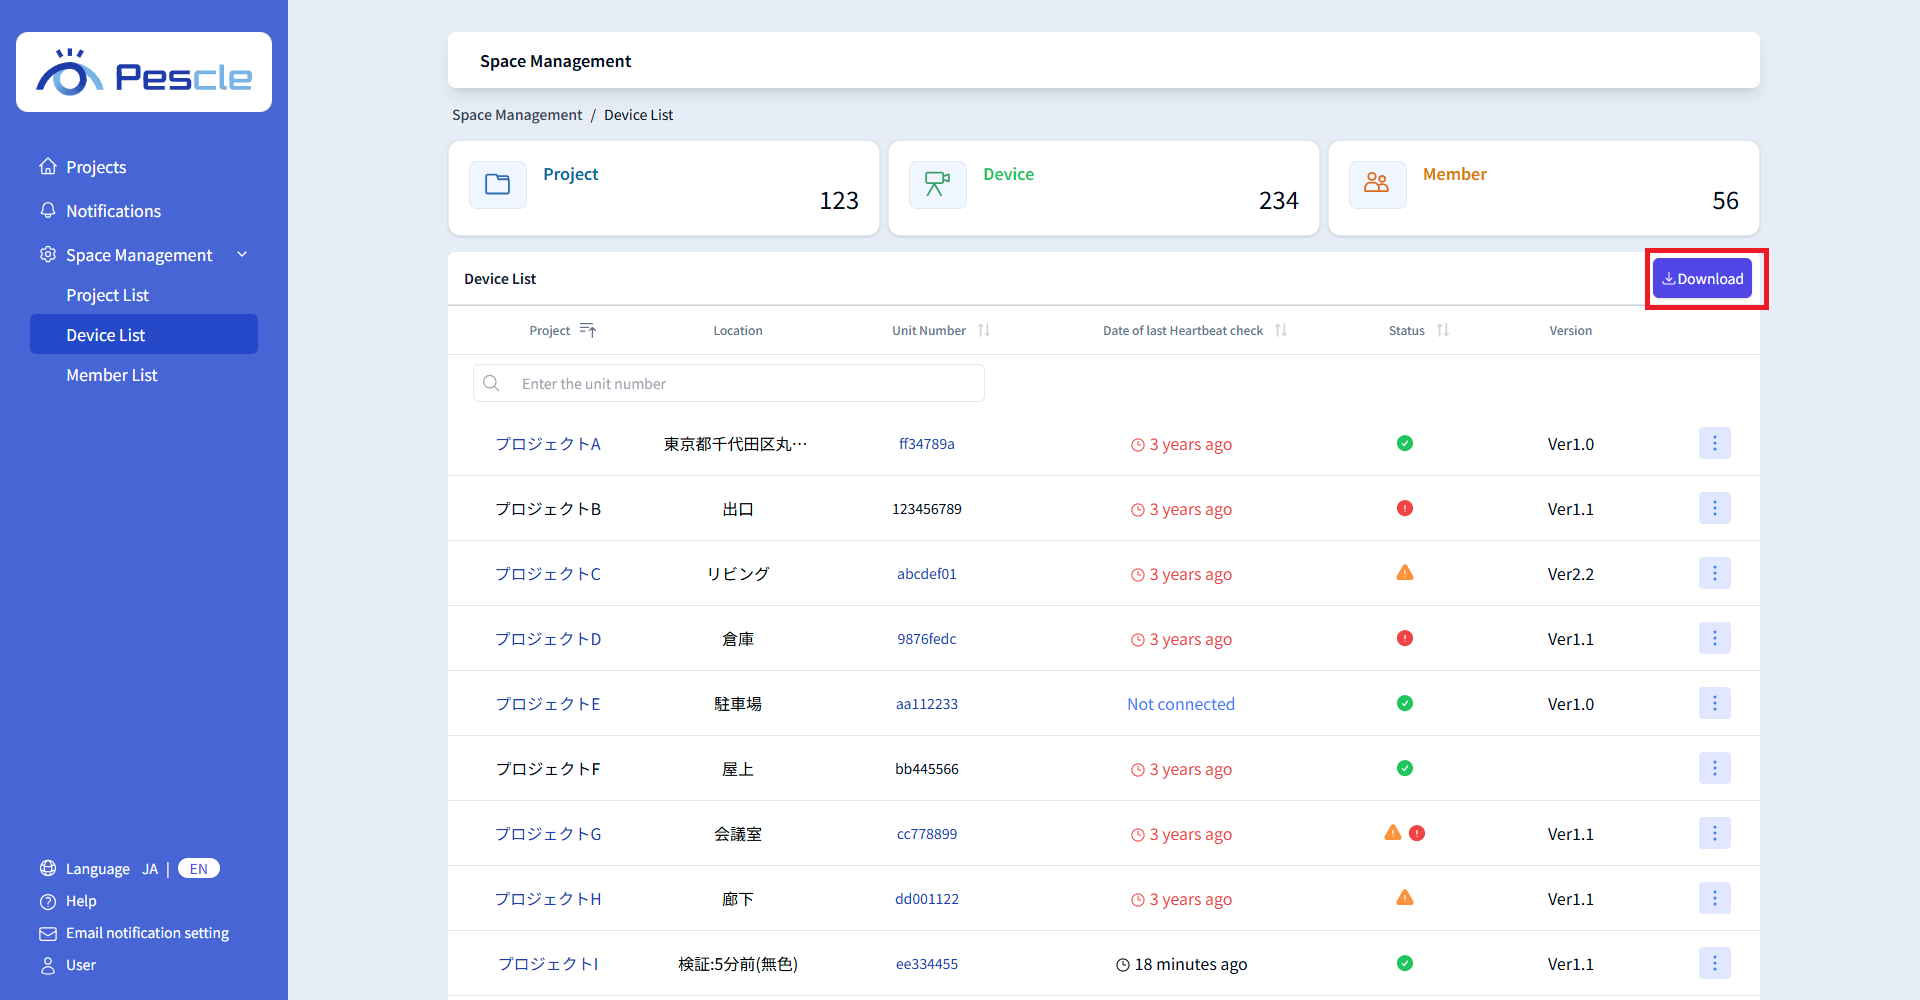
Click “Download” at the top right of the screen to download the device list as an Excel file.